Graph
The Graph view is all about visualizing the relationships between your ideas. Every piece of content in Verbweaver is a Node, and relationships (links) can be drawn between those nodes.
Mind Map
The Mind Map sub-view is a traditional mind map style of graph that lets you visually arrange your nodes and draw links between them. This is a convenient dashboard for brainstorming ideas. Don’t focus on the details yet; just on the the big picture.
Outline
Mind maps are great for visualizing conceptual or organizational relationships between information, but they don’t tell you the proper ordering of that information. The Outline sub-view enables you to transform your nonlinear organization into a linear organization and copy that outline to use it elsewhere. This is useful, for example, when you want to think about how to order your scenes in a chapter or your sections of a report.
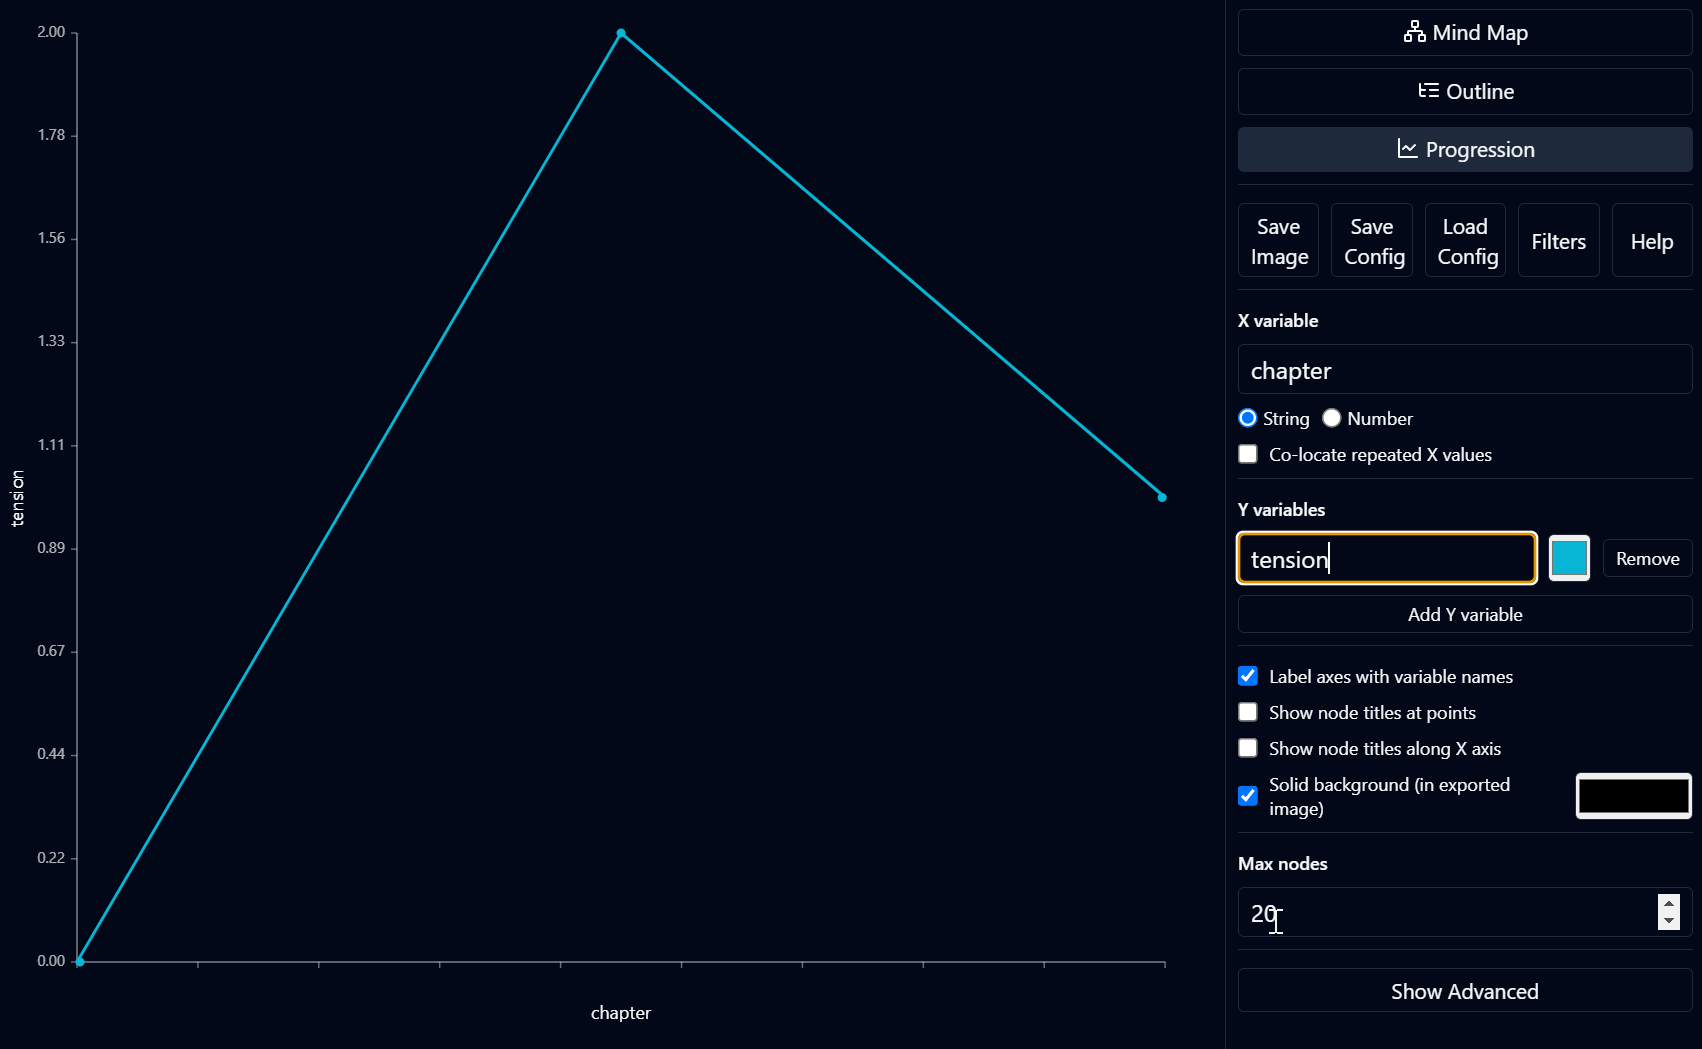
Progression
While a nonlinear design has its advantages, it can be tough to understand how a variable changes between somewhat-related nodes. The Progression view lets you chart out node variables on a line plot graph. Suppose you have 10 disparate nodes that all have the same variable. Specify the variable(s), filter for those nodes, choose the order of nodes on the X axis, and see how the variable(s) change.